


A test for cancer is positive 99% of the time that a patient actually has cancer, and is negative 95% of the time a patient does not have cancer (suppose only 1/1000 in the population has this type of cancer). Question: if a patient's test comes up positive, what is the probability he has cancer?
This is a simple-sounding question and one that is definitely pertinent. One might reason that it's either 99%, or 95%, but neither is correct. It's only about a 2% chance that the patient has cancer if his test comes up positive.
Why is this, and what do the probabilities above represent if not the answer to this question? Both are conditional probabilities: The first says that if a person has cancer, then his test is positive 99/100 times and negative 1/100 times. The second says that if a person does not have cancer, then his test is positive 5/100 times and negative 95/100 times. Finally, we know that 1 person out of 1000 has this cancer. Never do we say what the probability is of having cancer if the test came up positive.

The tree diagram for all possible cases is above. What you're trying to evaluate is what the probability is of being in the top-most group (has cancer and tested positive) if all you know is that you tested positive.
Prior and posterior probability
Any time that we are given some extra information, we need to reweigh our odds. As a simple example, say your friend rolls a die and asks you to guess the number it came up. The probability of any given number coming up is 1/6, and so your chances are only 1 in 6 of guessing correctly. But if the person posing the question then tells you that the number that came up is greater than 4, now you have a 1/2 probability of guessing it correctly, since only two equally probable options are possible (a 5 or a 6). Your odds have greatly improved.
A slightly less simple example: suppose we have two bags, called I and II. Bag I has 2 red and 3 green balls. Bag II has 1 red ball and 1 green ball. We randomly choose a bag, and randomly choose a ball from that bag.

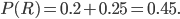
We can now answer some questions. What is the probability of choosing a red ball? It's the probability of choosing bag I and choosing a red from it, plus the probability of choosing bag II and a red from it. We just add all branches that end in red:
But let's add a conditional. Suppose you want to know what the probability of choosing red is given that bag I has been chosen. We can write it  , so the line means "given". If we know we've chosen bag I, then the probability of getting red is just 0.4, since we know we're confined to that part of the tree. Simple.
Now we ask another question: suppose we picked a red ball. What is the probability we chose bag I? Not so simple! You might think it's 2/3, since 2 out of 3 red balls reside in bag I. But you aren't as likely to pick these as you are to pick a red ball from bag II. We need a systematic way to figure out the likelihoods.
First, whenever possible I like to run the experiment and see what the answer is. Since this would be time consuming, we just have a computer do it 5000 times, choosing random numbers according to the specified probabilities. I get these numbers of outcomes:
| red | green | totals | |
| bag I | 1038 | 1461 | 2499 |
| bag II | 1215 | 1286 | 2501 |
| totals | 2253 | 2747 |
The observed probability of choosing red given that bag I was been chosen is 1038/(1038+1461) = 0.4154, close to the value we calculated of 0.4. Now, we can also calculate the probability of having chosen bag I if you got red, which is 1038/(1038+1215) = 0.4607, somewhat different from 2/3.
Calculating proportions across the rows of the table is like calculating in the tree above, giving the prior probabilities. Calculating down the columns is doing the inverse dependence, called the posterior probabilities. The row has information about probability of red given bag I, whereas the column has information about the probability of bag I given red. And it is the posterior probability for the cancer question that we want to get at. That is, we know all about what happens to the tests given cancer or no cancer, but we want to know cancer/no cancer given a test result of positive.
With the above in mind, it ought to be clear that
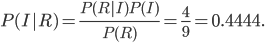
The numerator is the probability of getting red from bag I, which the tree tells us is 0.2, and the denominator is the probability of getting a red in any way, which the tree tells us is 0.2 + 0.25 = 0.45. This value is similar to the simulation. It's a bit neater to write  , the probability of getting red from bag I, as
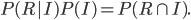
Both  and
and  represent sets, so this is the intersection of sets.
Finally
In exact analogy to the previous problem, the probability of having cancer given that your test was positive is

or about a 2% chance. Most tests that come up positive under such conditions are false positives. In retrospect, this should have been obvious. If we look at all the people who got positive results, a much larger proportion are in the third branch of the tree diagram, a false positive. Grinstead and Snell report that when "a group of second-year medical students was asked this question, over half of the students incorrectly guessed the probability to be greater than .5". Even if both tests were 99% accurate, the probability of a false positive would still only be 1/2, not larger.
1 comment
Greg
10/11/2012 at 11:46 AM (UTC -4) Link to this comment
relevant:
http://www.slate.com/articles/health_and_science/science/2012/10/how_do_children_learn_so_quickly_bayesian_statistics_and_probabilities_help.html