Bill Maher is fond of repeating his line: "Being a Republican doesn't make you a racist, but if you're a racist you're probably a Republican." This attitude has obvious anecdotal examples to support it. The numerous racist signs shown at Tea Party rallies, the incredibly low minority support for and participation in the GOP, things like the awful Chik-fil-a demonstrations, it's a bit of a natural identification.
But perhaps the most provocative association is with the GOP and the voting bloc consisting of the states of the former Confederacy. Andrew Sullivan mentioned on This Week that if Obama loses Florida and North Carolina, every single Confederate state will be giving its electoral votes to Mitt Romney, something that ought to be disconcerting given that they once led a bloody rebellion in this country.
However, I was most recently drawn to this topic by Ron Rosenbaum's piece on Slate, where he essentially says that the press should go ahead and brand the GOP as a racist party, much like a neo-nazi party would be labeled as such. The three page screed's main argument depends on "sophisticated" statistical techniques cited in a book. That book drew from a paper titled "Old Times There Are Not Forgotten: Race and Partisan Realignment in the Contemporary South" (American Journal of Political Science, Vol. 49, No. 3, July 2005, pp. 672–688) by Nicholas A. Valentino and David O. Sears.
I'm naturally suspicious of any statistical technique that is termed "sophisticated". If the numbers need to be teased that much, it could be that the conclusion the authors want just isn't there. I read the paper in detail, along with the results of the other survey mentioned in Rosenbaum's article, and I'd like to just spend some time explicating exactly what the results were.
The quick take-away is two things. 1. There's nothing particularly sophisticated about any of it, the techniques are pretty basic behind all the jargon. 2. I'm not sure the conclusion is justified without also investigating other factors (I have a particular one in mind). There is some evidence to support the conclusion, but it's far from clear.
Symbolic versus Jim Crow racism
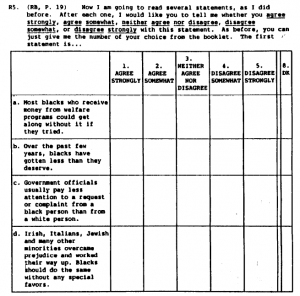
Basically all of the results in the paper are analyzed as a function of what the authors term "symbolic racism", rather than traditional or "Jim Crow" racism, of the virulent type that existed especially before 1965. Symbolic racism is defined to be a propensity to answer the following questions in the specified ways:
| Question | Symbolic racist response |
|---|---|
| Irish, Italians, Jewish, and many other minorities overcame prejudice and worked their way up. Blacks should do the same without any special favors | Agree |
| Over the past few years blacks have gotten less than they deserve | Disagree |
| It’s really a matter of some people not trying hard enough; if blacks would only try harder they could be just as well off as whites | Agree |
| Generations of slavery and discrimination have created conditions that make it difficult for blacks to work their way out of the lower class | Disagree |
Answers to these were measured in 1986, 1988, 1990, 1992, 1994, and 2000 by the American National Election Studies along with party identification and several other variables (the latter 2 were also asked in 1972). The pollster asked for the responder to rate how well much they agreed, on a scale from 1 to 5, with the statement.
The sample sizes of each were generally quite large ( > 2,000 people per survey), so there is fairly good sampling statistics (the rolling Gallup tracking poll employs around the same number of samples).
The authors make use of two relatively simple tools, both of which are regressions, which really just means fitting points on a graph to a given curve as closely as possible. The two regressions used are the linear regression (with some minor modification) and the logistical regression.
Linear regression of racism vs time
The linear regression is used to investigate how symbolic (or, I might call it, casual) racism changed over time, and how well correlated this was for identifying as a Republican or being from the south. So, suppose we took the average racism answer in the quiz questions and plot that versus time. One would find that the trend was positive between the years of interest. But you also want to know how that breaks down for the different regions, and in particular the former confederacy (South Carolina, Mississippi, Florida, Alabama, Georgia, Louisiana, Texas, Virginia, Arkansas, Tennessee and North Carolina) versus the North or West regions of the US.
It wasn't too hard to recreate the researchers' data sets, so I did. They only use the 3rd and 4th questions on symbolic racism and code this as a number between 0 and 1. Since they don't say, I did some guesswork about how they calculated things. I assume they calculate symbolic racism according to

 and
and  are the answers for those questions on a 1 to 5 point scale (1 is strongly agree). So if you answer that you strongly agree with question 3 and strongly disagree with question 4, you are
  or 100% racist, whereas strongly disagree and agree, respectively would be
  racist (anyone who said "inapplicable gets set to a 3, neither agree nor disagree"). Party ID is indexed by dividing the designed variable (0 to 6) by 6.
The authors play a little bit loose with the rules. In 1998 questions 3 and 4 were not asked, so my presumption is that they used questions 1 and 2 as a proxy for symbolic racism. Also, whenever someone refused to answer the questions (answering "inapplicable") they were automatically called 0.5 racist for the purposes of the regression. Is that really true? Mightn't somebody refuse to answer a question that sounds stupid or offensive? In 1972, it appears that these questions weren't even asked for part of the data set, as there are a suspicious number (1372) of consecutive refusals to answer either question.
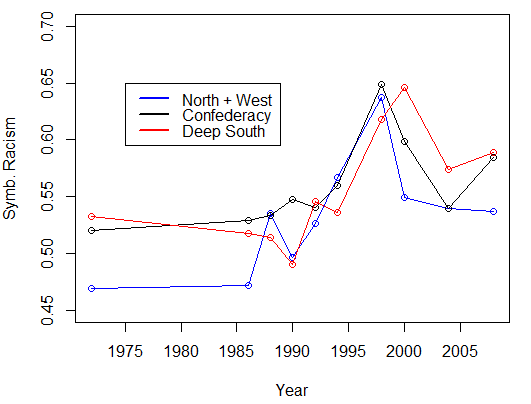
I was unable to replicate their numbers, using the same data set. This may be because I've made a mistake, or they did, or their methodology is underspecified in the paper. In any case, their point still holds that the south, especially the Deep South but also the old Confederacy, has a higher symbolic racism index than the rest of the nation. I expanded their data set to include 2004 and 2008, which were unavailable when the paper was published:
It's not very consistent and not very large. Both sets peak at about 0.65, with the Deep South trailing by about two years. In 2008 the rest of the country was significantly below the Deep South and the former Confederacy. I find several years where the Deep South actually has a lower symbolic racism, though it hasn't happened since 2000.
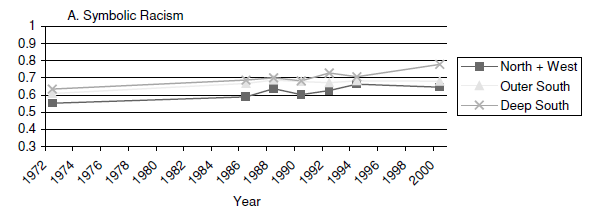
The result appears somewhat more significant in their paper:
They show about a 15 point difference, whereas I can only see about 10 points.
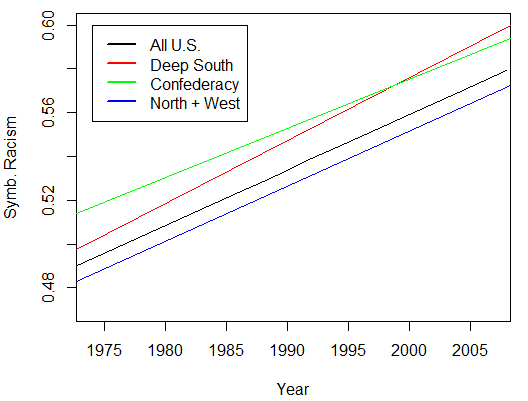
If we look at the results of a linear regression taking into account all the points, the trend is a little less muddy
These results are highly statistically significant. The North + West has clearly been increasing, but it is consistently lower than the South and especially the Deep South.
Party ID and racism
The authors also look at the likelihood of voting Republican as a function of symbolic racism. They use the logistical regression, which is the same as a linear regression except that it returns a probability of something by using a link function. The independent variables are time and racism, with either 0 or 1 as the dependent variable (namely: did you vote Republican or not). I did not attempt to recreate this curve, but my guess is that I would have found something similar:
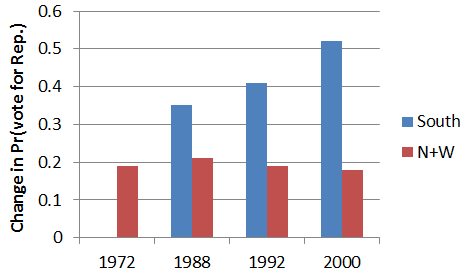
Probability of voting for Republican due to symbolic racism as a function of time for the South (data from Valentino and Sears)
While there is a tendency for racism to promote the GOP in all states, this effect has been growing in the South. Again this is highly statistically significant.
Is any of this true?
I have to wonder: are questions 3 and 4 really a good proxy for measuring racism? There is a lot of discussion in the political science literature about this, but I'm not convinced. For instance, it is entirely possible that the answers to these questions are dominated by the profusion of laissez faire capitalism that cropped up in the Reagan era and remains with us to this day. Also, since racism and Republicanism are both monotonically increasing functions of time, any other variable that does so could be responsible.
I'm thinking principally of religion and the desire to integrate religion with politics. The authors themselves acknowledge this:
But the scope of any single article must always be limited in some ways, especially in attempting to explain as broad a phenomenon as party realignment. So, for example, we could not test social class (Black and Black 2002; Petrocik 1987) or religion-based (Green et al. 2003) explanations for Southern realignment.
It's probably a good idea not to read too much into this. Is it possible that this kind of casual racism is responsible? Sure. Is there much evidence to support it? Not really. The ANES polls are a great resource for some variables, but this topic is too muddy, and the way of measuring "racism" too crude and questionable, to be of much help.
I think that the entire former Confederate states will probably break for Mitt Romney this Tuesday. But so are a lot of other subgroups of the country, principally ones with white, but not necessarily racist, voters.


